Analytics
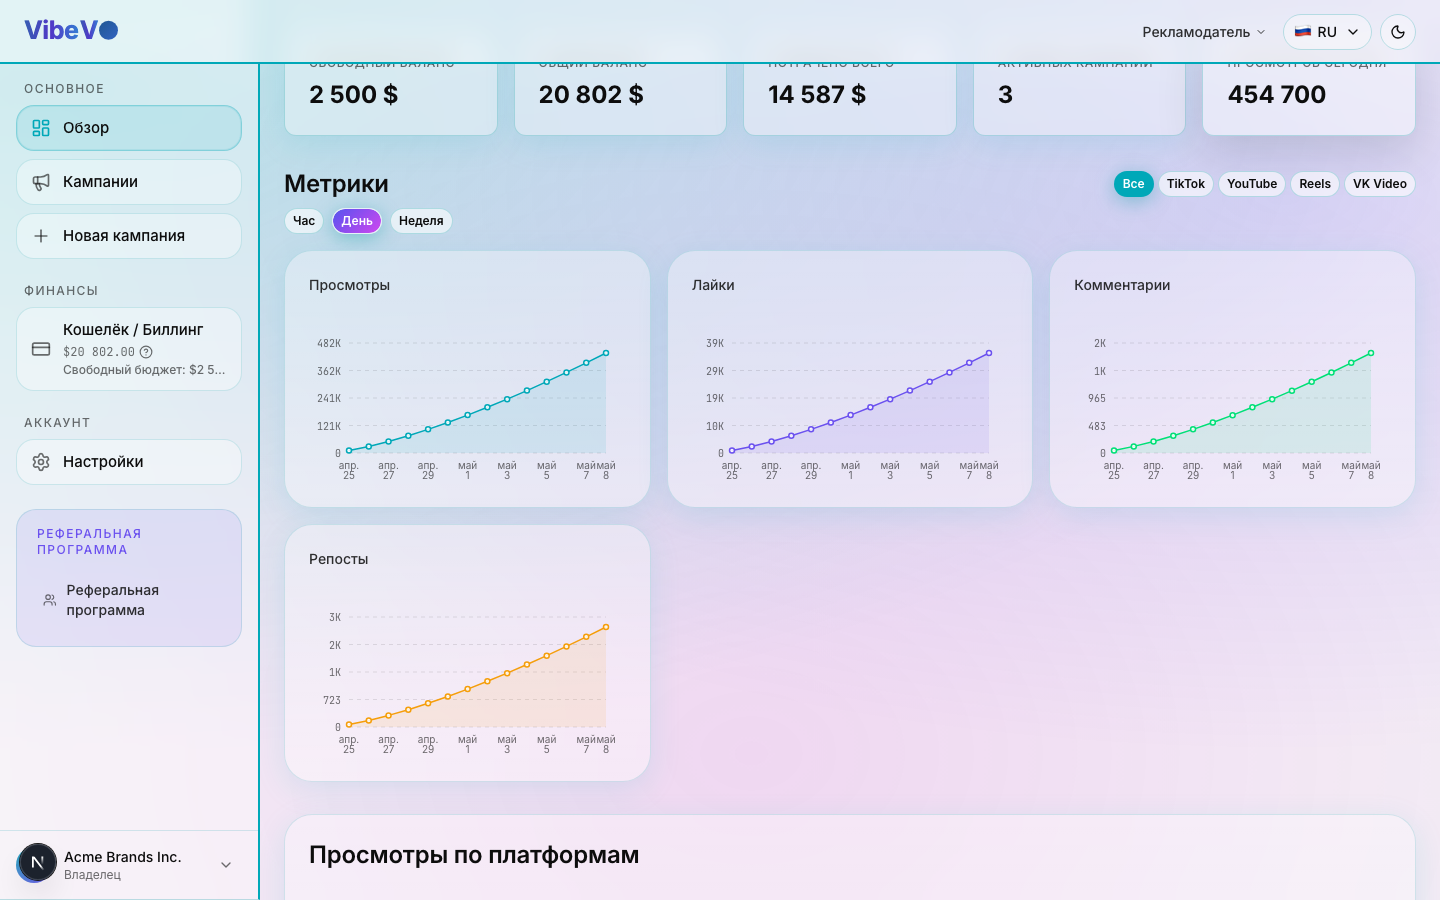
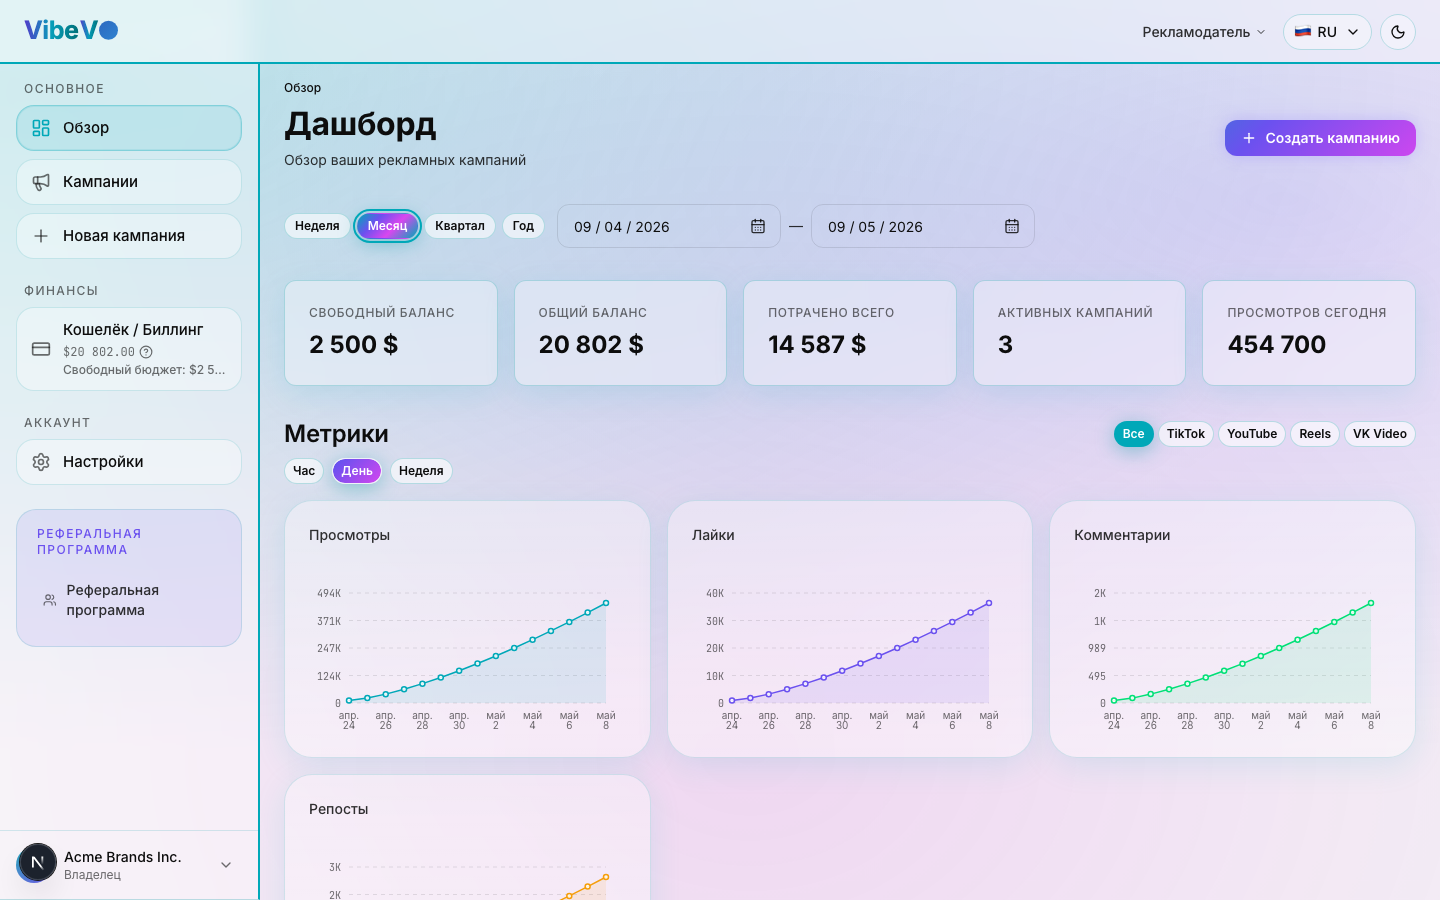
The Analytics section shows the dynamics of your campaigns on the platform. Charts help you understand which platforms and regions deliver the most reach and inform optimization decisions.
Charts
The charts section visualises views distribution and dynamics. Available charts:
- Views by platform — distribution of views across YouTube, TikTok, Instagram, VK Video
- Views over time — view dynamics across the selected period
- Campaigns by geo — view distribution across countries and regions
- Daily views — table of total views per day
Period filter
Use the period selector to analyze data for any time range:
- Last 7 days
- Last 30 days
- Current month
- Custom range (date picker)
Per-campaign details
To drill into a single campaign, open its details page: it shows the campaign KPIs, the post list, and view dynamics.
Compare matching periods and formats. Use results to improve future briefs and materials. Editing a running or paused campaign is permission-restricted; contact support if the action is unavailable.
Updates depend on social-platform data availability and review results. Delays and later revisions are possible; check the latest successful update instead of assuming a fixed schedule.
Chart modes and periods
Cumulative mode (∑) shows the accumulated result; Delta (Δ) shows the change in each interval. Choose Delta to assess how quickly views are growing.
Example: 100 views existed before the selected period, then 20, 30 and 10 were added on three days. With the starting baseline retained, the cumulative series is 120 → 150 → 160; Delta is 20 → 30 → 10. A baseline before the range prevents the first interval from including all earlier history. Compare charts using the same period and filters.
In content factories, publication-date filters select posts, while trend charts use the history of measurements. These are different time axes. Balance cards may show current funds, not a sum for the selected period.
Audience estimates
Geography, gender and age are estimates based on available social-account audience data, weighted by views of their posts. They are not direct measurements of every viewer of a specific post and are not unique reach.
Data may cover only some posts. Missing statistics do not mean zero viewers: consider the displayed coverage and “Unknown” category. Share of posts and share of views are different: a high-view post has more influence on a view-weighted estimate.
Clicks and CPC
Clicks are measured through tracking links. Known bots are excluded, and repeat clicks from one device on the same link are combined within the selected report. Network and browser signals help distinguish devices; this is a device estimate, not a verified count of people.
The same device can count separately on different links. In daily charts, it is attributed to its first click on that link within the selected period. When matching signals are unavailable, an event may count separately.
CPC = confirmed spending ÷ counted clicks. For example, 30 USD and 10 clicks gives 3 USD per click. With zero clicks, a dash is shown instead of a price. If tracking is not set up or data is unavailable, do not infer a lack of interest.
A click is a visit, not a purchase, lead or registration. Evaluate those outcomes using your destination-page data.
Was this article helpful?
Updated: September 23, 2026